Abstract
Cancer Clinical Medicine is hard to get right, even though clinicians have rulebooks (“standards of care”) describing how to treat patients. These rulebooks are expanded via experiments called Clinical trials. Cancer (Oncologic) Clinical Trials are even harder to get right, as evidenced by their 3.4% success rate. Harder still is rare cancer research, which is typically done in university labs, funded by private donations or small government grants (e.g. CDMRP). Worse, the speed of results generated via these approaches is often too slow to help existing patients (like me).
Data + Tools + Collaboration -> Published Research -> Diagnostics + Therapeutics
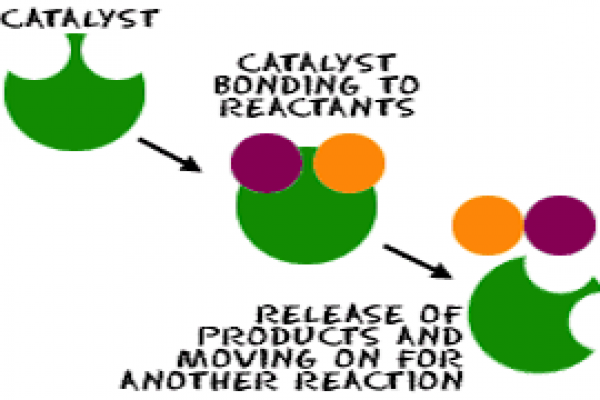
So what “patients like me” need to do is find way to "Accelerate Treatment Discovery". Here, we will describe our efforts using a concept from chemistry. Chemists generate new chemical "products" by "reacting" (chemically combining) different "reactants". Reactions can be sped up using a catalyst which lowers the energy needed to "activate" the reaction. What we need is a “research catalyst”. Something that takes the same reactants used in traditional research (Data + Tools + Collaboration), lowers the activation energy and quickly generates intermediate products (Published Research) which convert to final products (Diagnostics + Therapeutics).
Over the last 3 years, I have been exploring ways to use “hackathons” as that catalyst. Unfortunately, "hackathons" are an overused term. For some, hackathons are weekend events for programmers only. Some are used to promote a new product, or provide monetary rewards. None of these things are true for the events described here.
Here, hackathons are social research events organized around a single patient. The patient's primary role is to inspire, and to supply research grade data to an invited group of Bioinformaticians, Cancer Biologists, Clinicians and Data Scientists. Members of this group form several teams and after a few days, present results of their investigations centered on the patient’s diagnosis and treatment. The hackathon is a charitable event and the atmosphere is collegial, more akin to a party or a French salon than a competition. No one is paid to come, although the organizer does provide a venue and refreshment.
This paper first discusses how two hackathons got data, collaborated and produced results quickly. It then describes post-hackathon methods used to combine, prioritize and follow up on hackathon results. In the body of this paper we detail the following events.
- May 2018 hackathon: Sv.ai and rarekidneycancer.org held their first p1RCC hackathon with 17 teams. Each team was given my tumor and normal DNA data. They then presented “genes of interest” 3 days later. Several teams, working independently, recommended the same gene of interest. So “discovery overlap” was used as a scoring function to decide which of the 119 total “genes of interest” to pursue after the event. This Hackathon produced one paper from the Clemson team, published in scientific reports.
- March 2020 hackathon: Sv.ai and rarekidneycancer.org held their second p1RCC hackathon with 2 teams. Each team was given my tumor and normal RNA-seq data several months in advance. One team (Lead by Reed Bender from Clemson’s Alex Feltus Lab) produced a list of 18,000 over and under expressed genes in a normalized cohort containing my tumor and those of 5 TCGA patients ("Clemson's 2020 normalized cohort"). The second team, GeneXpress (lead by Jeannette Koschmann), then used Clemson's 2020 normalized cohort to make therapeutic recommendations. This Hackathon produced one paper from the Clemson team, published in Cell.
- November 2020 followup: QuantumInsights.io combined Clemson's 2020 normalized cohort with a TCGA pan-cancer dataset and discovered that my data clustered close to Thyroid Cancer. This was interesting since unbeknownst to QuantumInsights.io, I had a sibling diagnosed with Thyroid Cancer earlier in the year.
- February 2021 followup: I (finally) ranked candidate genes from the 2018 hackathon using Clemson's 2020 normalized cohort. In essence, the 2020 differential expression list functioned as a “holdout set” to score the 2018 teams' results. One 2018 team, Biomarkers.ai, headed by Rutger’s Dr. Saed Sayad stood out. We dicuss the reasons for his success including data (GEO), tools (BIOada.com + Linear Discriminant Analysis) and team size (3 members).
- March 2021 followup: Eva Comperat discussed several new kidney cancer classifications at GUASCO 2021, including TLFRCC (Thyroid-Like Follicular Renal Cell Carcinoma). Given the November 2020 results, I combined the genes described in Ko’s "Whole-genome and transcriptome profiling of a metastatic thyroid-like follicular renal cell carcinoma" with Clemson's 2020 normalized cohort. However, none of Clemson's 2020 normalized cohort had abnormal expression of TLFRCC biomarkers. So if I have a genetic connection to thyroid cancer, it is likely not via TLFRCC.
Our key takeaway is that reimagining hackathon teams as ensembles of classifiers lets us apply ensemble learning techniques to monitor, speed up and direct the research process after the hackathon is done.
But the primary takeaway is that this effort required the time, help and support of a number of understanding clinicians, researchers and volunteers. Thank You.
Introduction
As the FDA’s Janet Woodcock points out, the current Cancer research model doesn't work very well for patients. And although getting patients involved in researching their own condition has provided results (e.g. Fajgenbaum), it does beg the question, is there a way for patients to get involved in researching their own disease short of raising money (which has been the traditional research "catalyst") or getting an advanced degree themselves? This post discusses one such alternative model called a hackathon.
We have described a hackathon’s value and process elsewhere, but in brief, a hackathon consists of a number of research teams concentrating on a single (rare disease) patient case for a few days using the patient’s research grade data in the hopes of making a more precise diagnosis and providing therapeutic recommendations. Hackathons treat two of the reactants (Data and Collaboration) and one intermediate product (Published Research) differently from classical research.
- Data: Biomedical data is notoriously tough to get. Efforts such as “Open Data” (akin to “Open Software”) and Pentland’s “Data Unions” might solve this problem eventually. But so far, most data is still siloed. Hackathons overcome the data issue by having the patient gather their own research grade data before the event, providing it to the participants free of charge and releasing all rights to it. This was time consuming in my case. I sent the DNA out to get processed and there was a question as to it's quality. The 2018 attempt to get RNA-seq data failed entirely. The 2020 RNA-seq attempt succeeded, but had to go through multiple steps of pre-processing. It literally took months. Having this reactant spatially local and preprocessed helps lower the energy required to get the reaction going.
- Collaboration: Arranging research collaboration between institutions sometimes takes years. Work being done by groups such as KCA and secureAIlabs using federated computing (and here) is showing promise. But progress here is also measured in quarters and years, not weeks and months. Hackathons overcome the collaboration issue by gathering all hackathon participants in one location for a small contiguous period (usually 3 days) where they can communicate either in person or get quick email response. A hackathon’s “French salon-like” atmosphere also promotes open communication. People attend for a variety of reasons. For example, some want to network, some have new tools that they want to try out, some know data science and want to see it can be applied to biology and some want to try out a pet theory. Attendance typically skews toward younger, nonestablished members of the research community. Having this reactant temporally local helps lower the energy required to get going.
- Published Research: Government sponsored research results are often not reported at all (alltrials.net and here). Hackathon results reported at the end of the event are published on GitHub immediately. Having the intermediate product visible enables further processing by other reactions.
So in summary, like chemical catalysts, hackathons provide a local environment that ensures the reactants have both spatial and temporal locality, intermediate results are visible and the effort (activation energy) is substantially lower. This doubtless sounds simplistic and obvious. But in a world where biomedical data is siloed, collaboration is stymied and results are unpublished, I've been in countless discussions where people ask with a straight face: "What can we do to go faster"? My response is "Hackathons". At their best, hackathons provide a small place and brief time where Science is "perfect". Where research "sprints" can be done in an ideal environment.
We will now discuss how how my hackathon results have been processed over time.
May 2018 p1RCC DNA hackathon
Sv.ai and rarekidneycancer.org held their first p1RCC hackathon with 17 teams. Each team was given my tumor and normal DNA data (extracted from FFPE tumor). I had attempted to get RNA-seq data as well, but the sequencing company was unable to extract anything from my OCT embedded tissue sample. A definite setback, but not without its upside as we will see later.
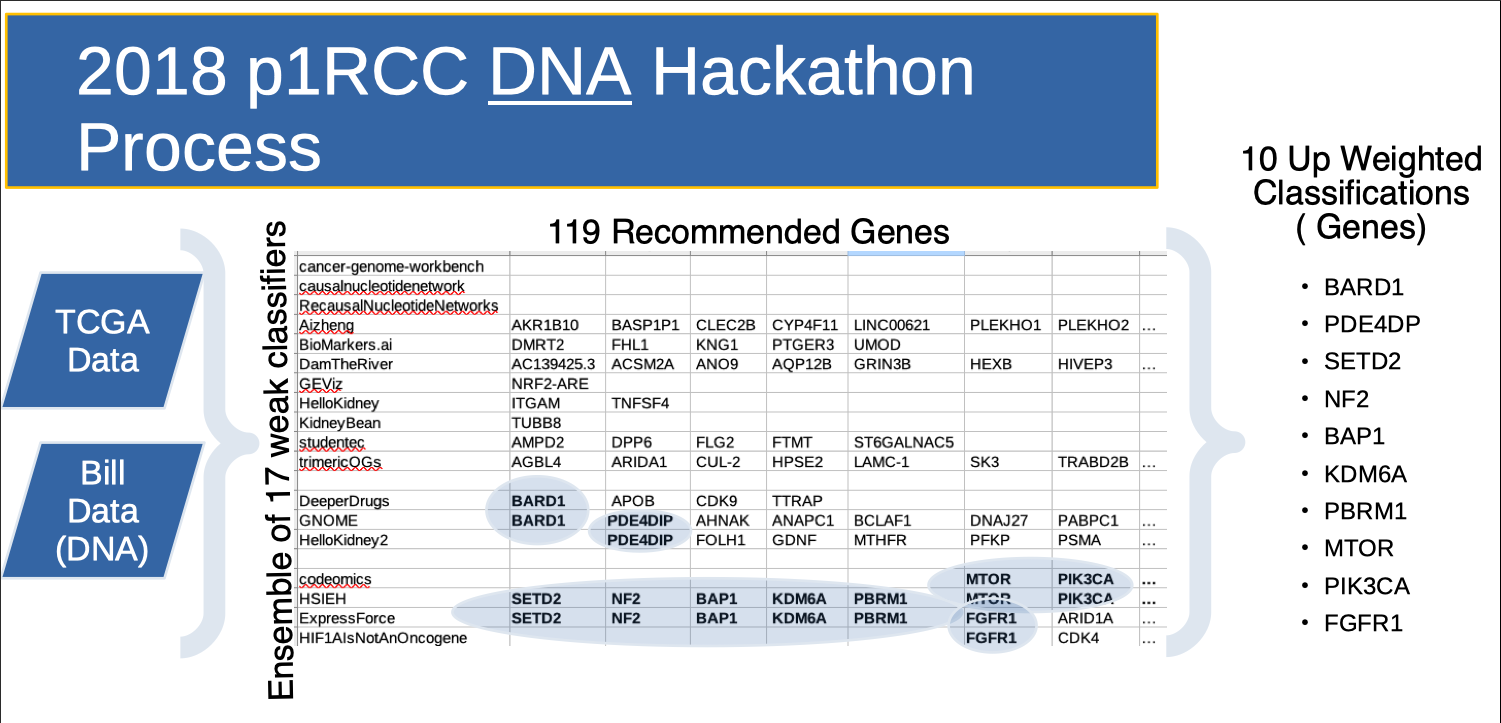
Teams then presented “genes of interest” 3 days later. Several teams, working independently, recommended the same gene of interest. So “discovery overlap” was used as a scoring function to decide which of the 119 total “genes of interest” to pursue. Note the HSIEH row. These are genes that Dr. James Hsieh (co-founder of rarekidneycancer.org) provided as a potentially strong candidates beforehand. This Hackathon produced one paper from the Clemson team, published in scientific reports.
March 2020 p1RCC RNA hackathon
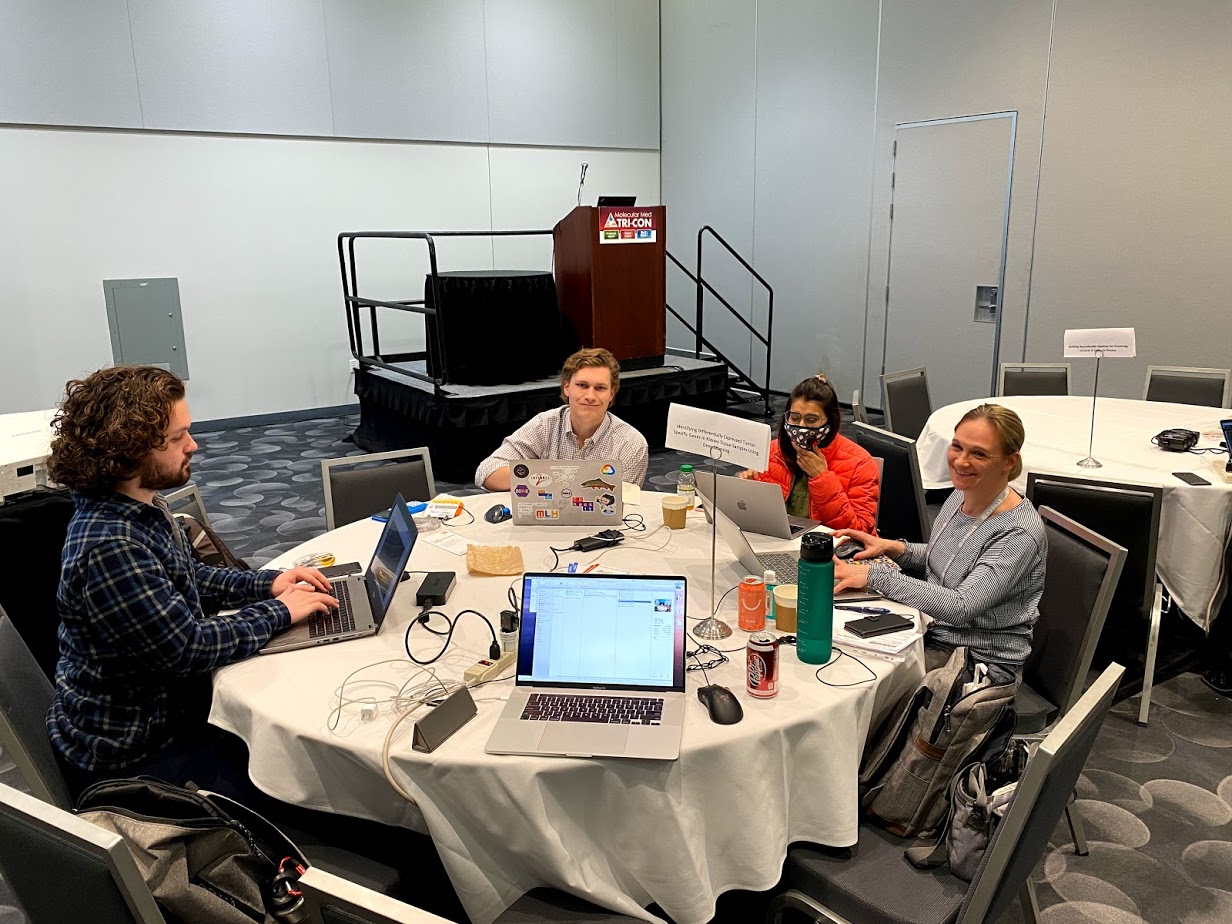
Sv.ai and rarekidneycancer.org held their second p1RCC hackathon with 2 teams (Clemson and Genexpress). Shortly after, QuantumInsights.io also participated.
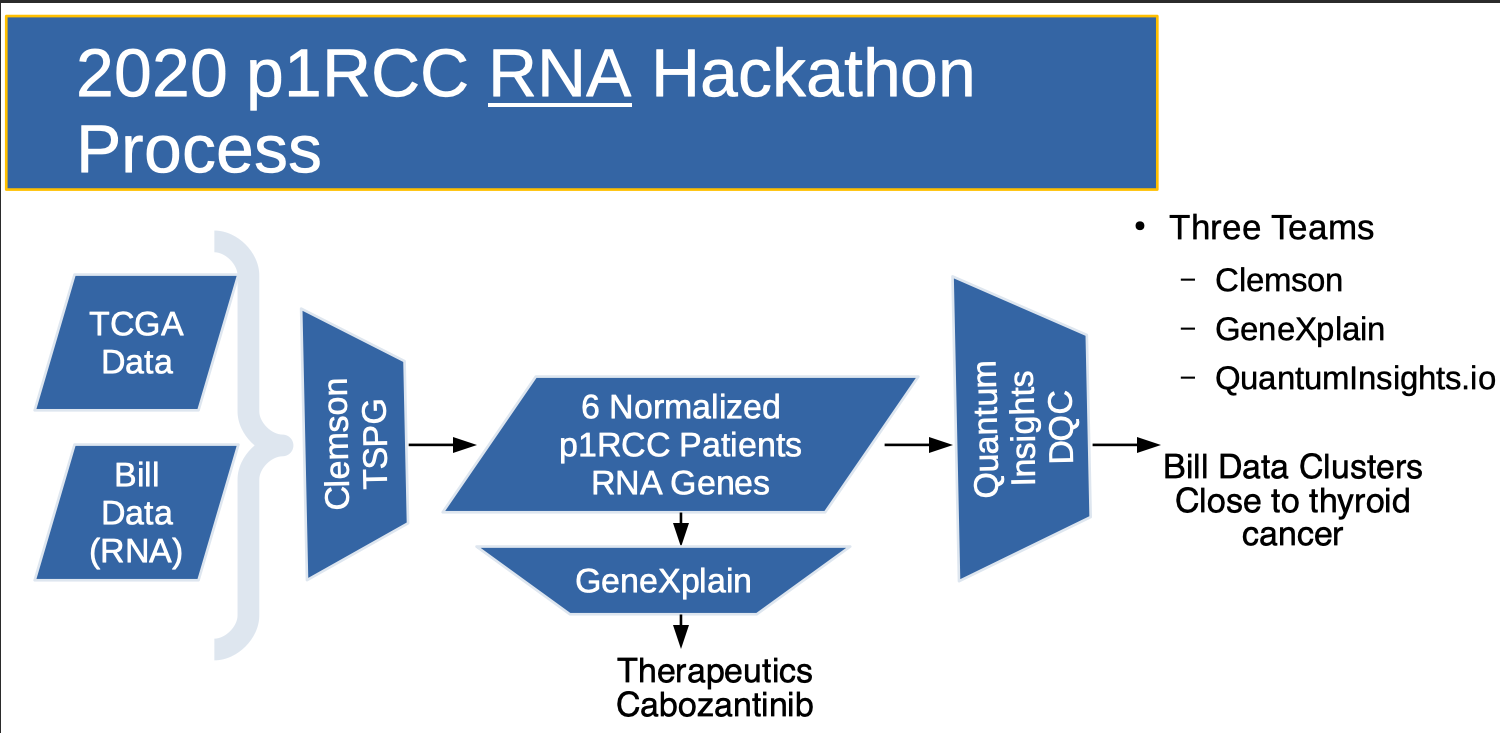
Clemson was given my tumor and normal RNA-seq data (processed by Yale University) several months in advance.
- The Clemson team (Team of 3, lead by Reed Bender from Clemson’s Alex Feltus Lab) produced a list of 18,000 over and under expressed genes in a normalized cohort containing my tumor and those of 5 TCGA patients ("Clemson's 2020 normalized cohort"). Their work is detailed in Cell. As will be seen later, creating a normalized cohort of 6 patients has been EXTREMELY valuable and has provided a foundation for all work going forward.
- The GeneXpress team (Team of 1, lead by Jeannette Koschmann), then used Clemson's 2020 normalized cohort to recommend a list of therapeutic candidates.
November 2020 Clustering TCGA with the Clemson 2020 normalized cohort
The QuantumInsights.io team (Team of 2, lead by Bernad Chen) ignored the differential expression information, but combined the 18,000 genes from Clemson's 2020 normalized cohort with a TCGA pan-cancer dataset and discovered that my data clustered close to Thyroid Cancer. This was interesting since unbeknownst to QuantumInsights.io, I had a sibling diagnosed with Thyroid Cancer earlier in the year.
There was considerable overlap between GeneXpress's and QuantumInsights.io's Therapeutic recommendations.
February 2021 Ranking 2018 Genes using 2020 Differential Expression
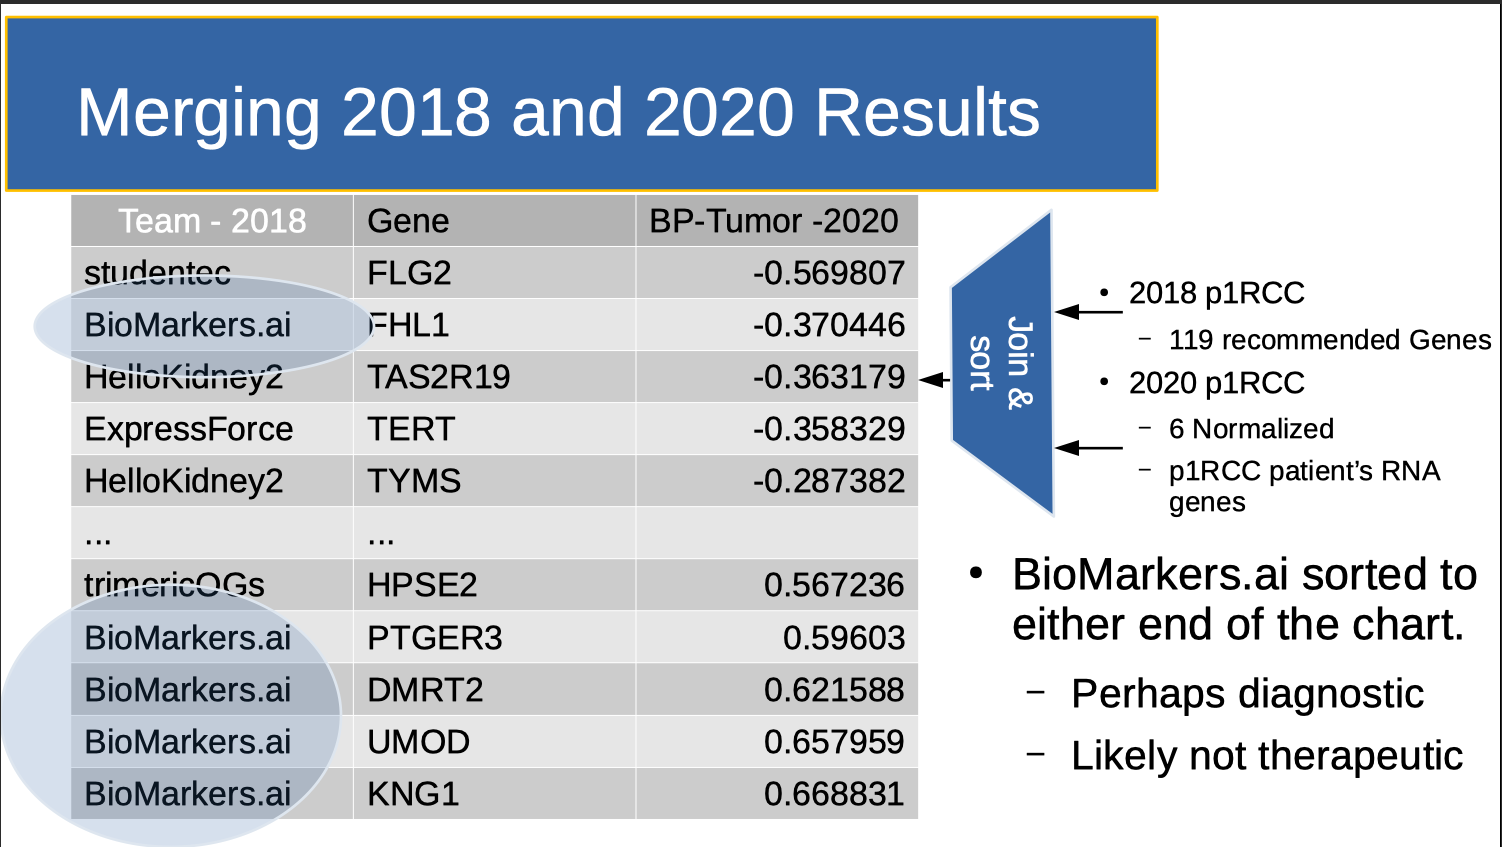
In February 2021, I (finally) ranked candidate genes from the 2018 hackathon using Clemson's 2020 normalized cohort. In essence, Clemson's 2020 normalized cohort functioned as a “holdout set” to score the 2018 results. This is shown in the table above. The middle column lists the genes discovered by all teams that were also in the normalized cohort. The left column shows the name of the team that labled this a "gene of interest". Occasionally, two teams identified the same gene. In this case, two rows were generated, one for each team. The far right column lists the gene's normalized, differential expression. "Differential Expression" (roughly) means the amount of the RNA generated in normal kidney tissue minus the amount of RNA generated in kidney tumor tissue. One 2018 team’s results, Biomarkers.ai, headed by Rutger’s Dr. Saed Sayad stood out. As I remark elsewhere:
- KNG1: uses alternative splicing to generate two different proteins: High MWt kininogen (HMWK) and MWt kininogen (LMWK). HMWK is essential for blood coagulation and assembly of the kallikrein-kinin system. This might explain my blood clotting history. I was originally diagnosed with a DVT. Kidney Cancer was an incidental finding after experiencing DVT symptoms again four months later while therapeutic on an anti-coagulant (Warfarin).
- UMOD: Uromodulin (encoded by UMOD; also known as Tamm-Horsfall protein) is the most abundant protein in mammalian urine under normal physiological conditions. Note also that UMOD is a focus in the Chronic Kidney Disease (CKD) community. However, note Dr. Feltus' 20210216 caveat: "No question it is a good biomarker but is a good drug target? Maybe your kidney was sensing an “infection” and produce lots of UMOD protein? Here is a great article on the subject." 20200406 - relooked over my medical record. I have gout, and its associated high Uric Acid levels. Standard levels are 2.6 - 7.2 mg/dL. Here are mine: 12/22/09 - 8.4 ; 10/18/11 - 7.8 ; 11/5/18 - 8.3. Requesting earlier records.
- FHL1: was an indicator for petrochemical exposure. For a time I worked in chemical refineries and on oil rigs. This might explain the source of (at least one) somatic mutation.
So. solid speculation. But here we are more interested as to what Dr. Sayad did to "catalyze" his results quickly and well. It was hardly a controlled experiment, but here we discuss three factors that we feel contributed to his results. They are "Research vs. Clinical Grade Data", "Tools" and "Small Team".
Research vs. Clinical Grade Data
Dr. Sayad ignored my DNA data and created his own normalized cohort based on NCBI GEO (Research Grade Gene Expression) data. This provided a stronger signal than my DNA data, and ultimately matched my RNA-seq data when it became available.
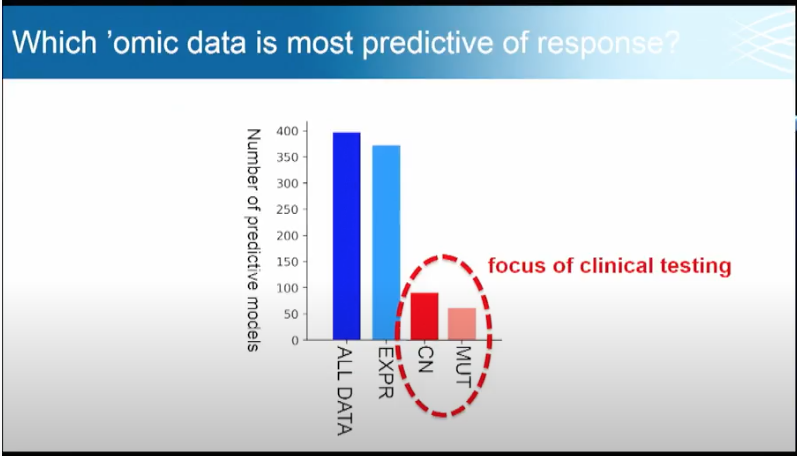
Broad's Todd Golub uses the slide below to show the value of Research Grade Data. In particular, Dr. Golub is interested in what omics data (e.g. genomics, proteomics, metabolomics, metagenomics) is most predictive of drug sensitivities and gene dependencies. MUT is SNV (Single nucleotide variant) data with single indels (gene insertions and deletes). CN is copy number (where sections of the genome are repeated and the number of repeats in the genome varies between individuals.). EXPR is gene expression data (e.g. the RNA-seq data used in the 2020 hackathon). Note the relative contribution of Research (Blue) vs. Clinical Grade (Red) data.
Tools
Dr. Sayad came to the hackathon with a set of favorite tools already in place (BIOada.com) which saved analysis time. However out of his tool suite, he used an old, relatively simple data analysis technique published by Fisher in 1936: Linear Discriminant Analysis. The above slide helps explain why a simple technique worked: Research data provides a stronger signal. So instead of using complex tools on (clinical) data with a weak signal, Dr. Sayad chose to use simple tools on (research) data with a strong signal. This directly supports Dr. Golub's recommendation of using research grade (EXPR) vs. clinical grade (red circled) data to obtain faster, better predictions of drug sensitivities and gene dependencies. The alternative is to spend a great deal of time trying to use stronger, more complex tools to draw conclusions from noisy, imprecise data.
Small Team
We can use "Clemson's 2020 normalized cohort" as a scoring mechanism another way. The table below shows some characteristics of the 2018 p1RCC teams' Gene choices.
- Total Genes - The number of "Genes of Interest" predicted by each team.
- Canonical Genes - Dr. James Hsieh presented "Genes of Interest" from p1RCC research papers. This count is the number of genes present in the Team's choices. Note that this list could also have been used as a "holdout set" to see if the teams would re-discover them.
- Overlapped Genes - Are the number of Genes shared with another team. For example, GNOME shares a BARD1 prediction with DeeperDrugs and PDE4DIP with HelloKidney2.
- TSPG Genes - are the number of total Genes that lie in "Clemson's 2020 normalized cohort" of 18,000 genes. (Note: the "Genes of Interest" NOT in the cohort included: BASP1P1, LINC00621, TTRAP, DNAJ27, PSMA, HER2, FTMT, LAMC-1, ARIDA1, SK3, NRF2-ARE, OR51A2, AC139425.3, MAB21L4, OR4F5, Z95704.2)
- Team Member Count - is the number of people in the team.
- Avg TSPG score - shows which average scores are greater than 0.19 (HelloKidney2, studentec and Biomarkers.ai). We calculate Average Score as follows. We take each gene from the team's "Gene of Interest" list and look up it's Differential expression from "Clemson's 2020 normalized cohort". We then average the collection of results.
| Total Genes | Canonical Genes | Overlapped Genes | TSPG Genes | Team Member Count | Avg TSPG Score | Team | |
|---|---|---|---|---|---|---|---|
| 0 | 8 | 0 | 0 | 6 | 8 | False | Aizheng |
| 1 | 5 | 0 | 0 | 5 | 3 | True | BioMarkers.ai |
| 2 | 20 | 0 | 0 | 15 | 8 | False | DamTheRiver |
| 3 | 4 | 0 | 1 | 3 | 10 | False | DeeperDrugs |
| 4 | 16 | 5 | 6 | 16 | 5 | False | ExpressForce |
| 5 | 1 | 0 | 0 | 0 | 4 | False | GEViz |
| 6 | 10 | 0 | 2 | 9 | 2 | False | GNOME |
| 7 | 8 | 0 | 1 | 7 | 4 | False | HIF1AIsNotAnOncogene |
| 8 | 19 | 19 | 7 | 19 | 1 | False | HSIEH |
| 9 | 2 | 0 | 0 | 2 | 1 | False | HelloKidney |
| 10 | 10 | 0 | 1 | 9 | 2 | True | HelloKidney2 |
| 11 | 1 | 0 | 0 | 1 | 12 | False | KidneyBean |
| 12 | 0 | 0 | 0 | 0 | 2 | False | QuantumInsights |
| 13 | 0 | 0 | 0 | 0 | 4 | False | RecausalNucleotideNetworks |
| 14 | 0 | 0 | 0 | 0 | 4 | False | cancer-genome-workbench |
| 15 | 0 | 0 | 0 | 0 | 4 | False | causalnucleotidenetwork |
| 16 | 3 | 2 | 2 | 3 | 2 | False | codeomics |
| 17 | 5 | 0 | 0 | 4 | 2 | True | studentec |
| 18 | 7 | 0 | 0 | 4 | 6 | False | trimericOGs |
In decision tree analysis, we call each of these table columns "features". And the goal is to see if we can split the data on any of its features to see if a single comparison better predicts the outcome. Running python's sklearn.tree.DecisionTreeClassifier with max_depth=2 on the table above produces the decision tree below. Note that Team Member count is the key bifurcation point, followed by the total genes guessed.
|--- Member Count <= 3.50
| |--- Total Genes <= 4.00
| | |--- class: False
| |--- Total Genes > 4.00
| | |--- class: True
|--- Member Count > 3.50
| |--- class: False
Below, we plot "Team member Count" vs "Avg TSPG score". Below it is a similar plot of "Gene Count" (the total number of "Gene of Interest" of each team) vs "Avg TSPG score". The "split" is apparent in both plots.
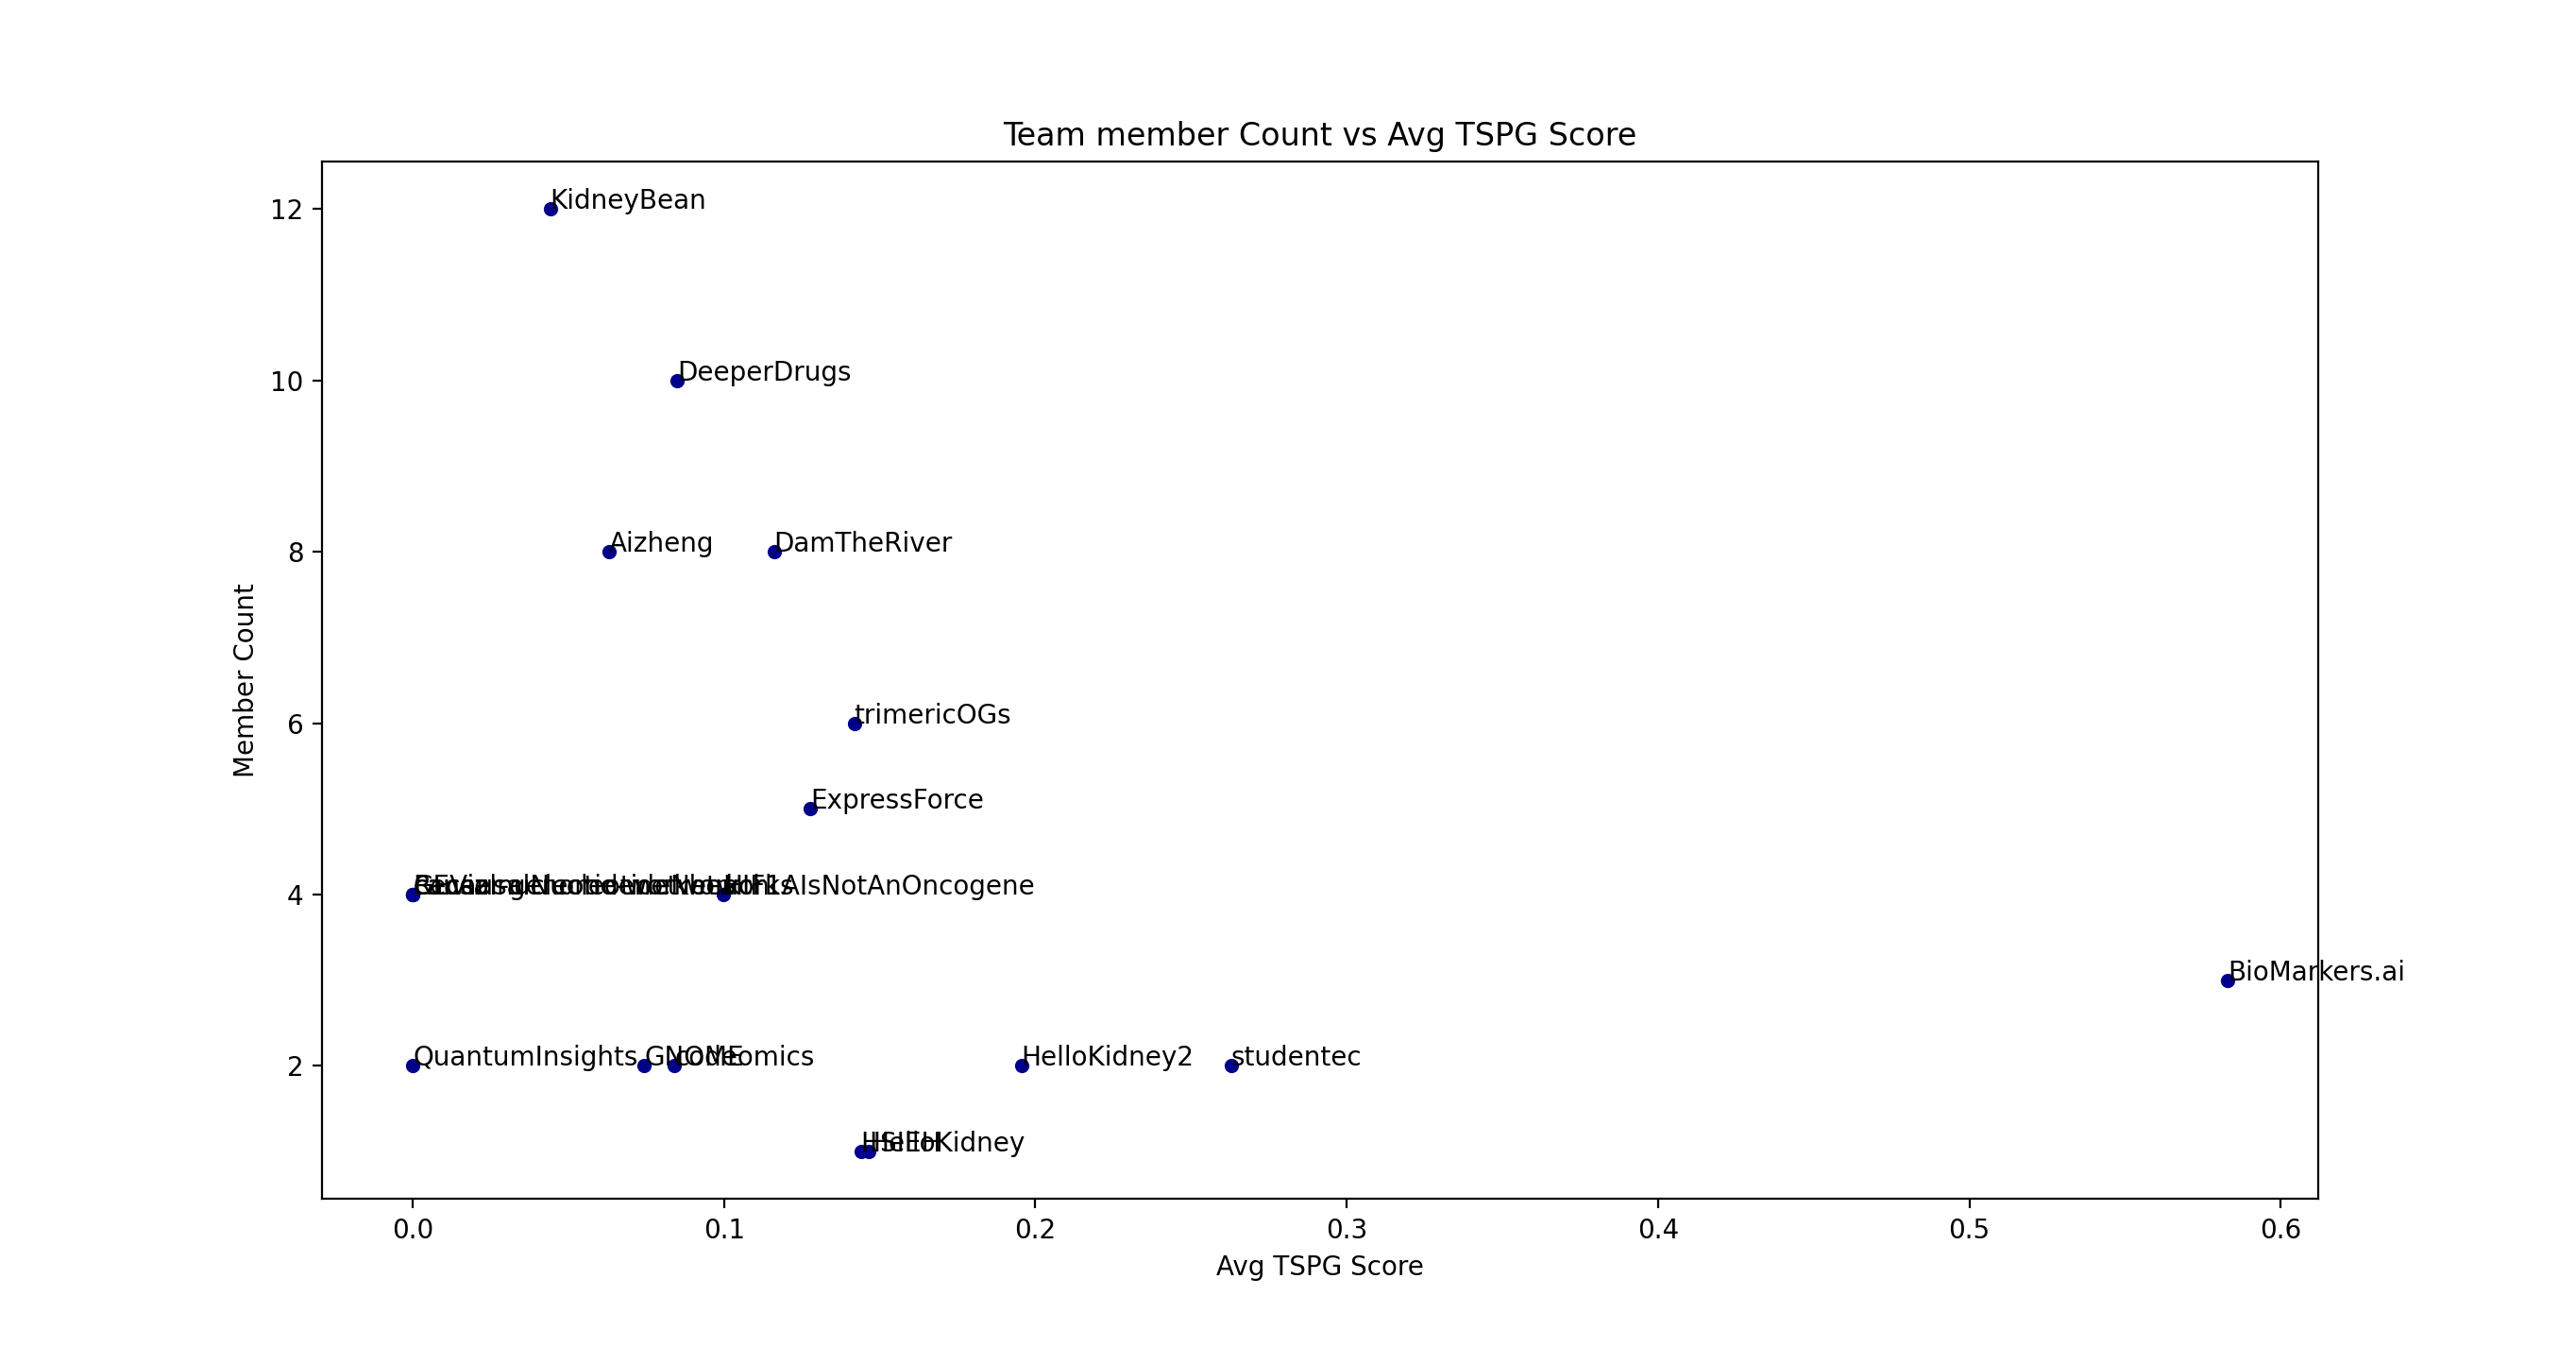
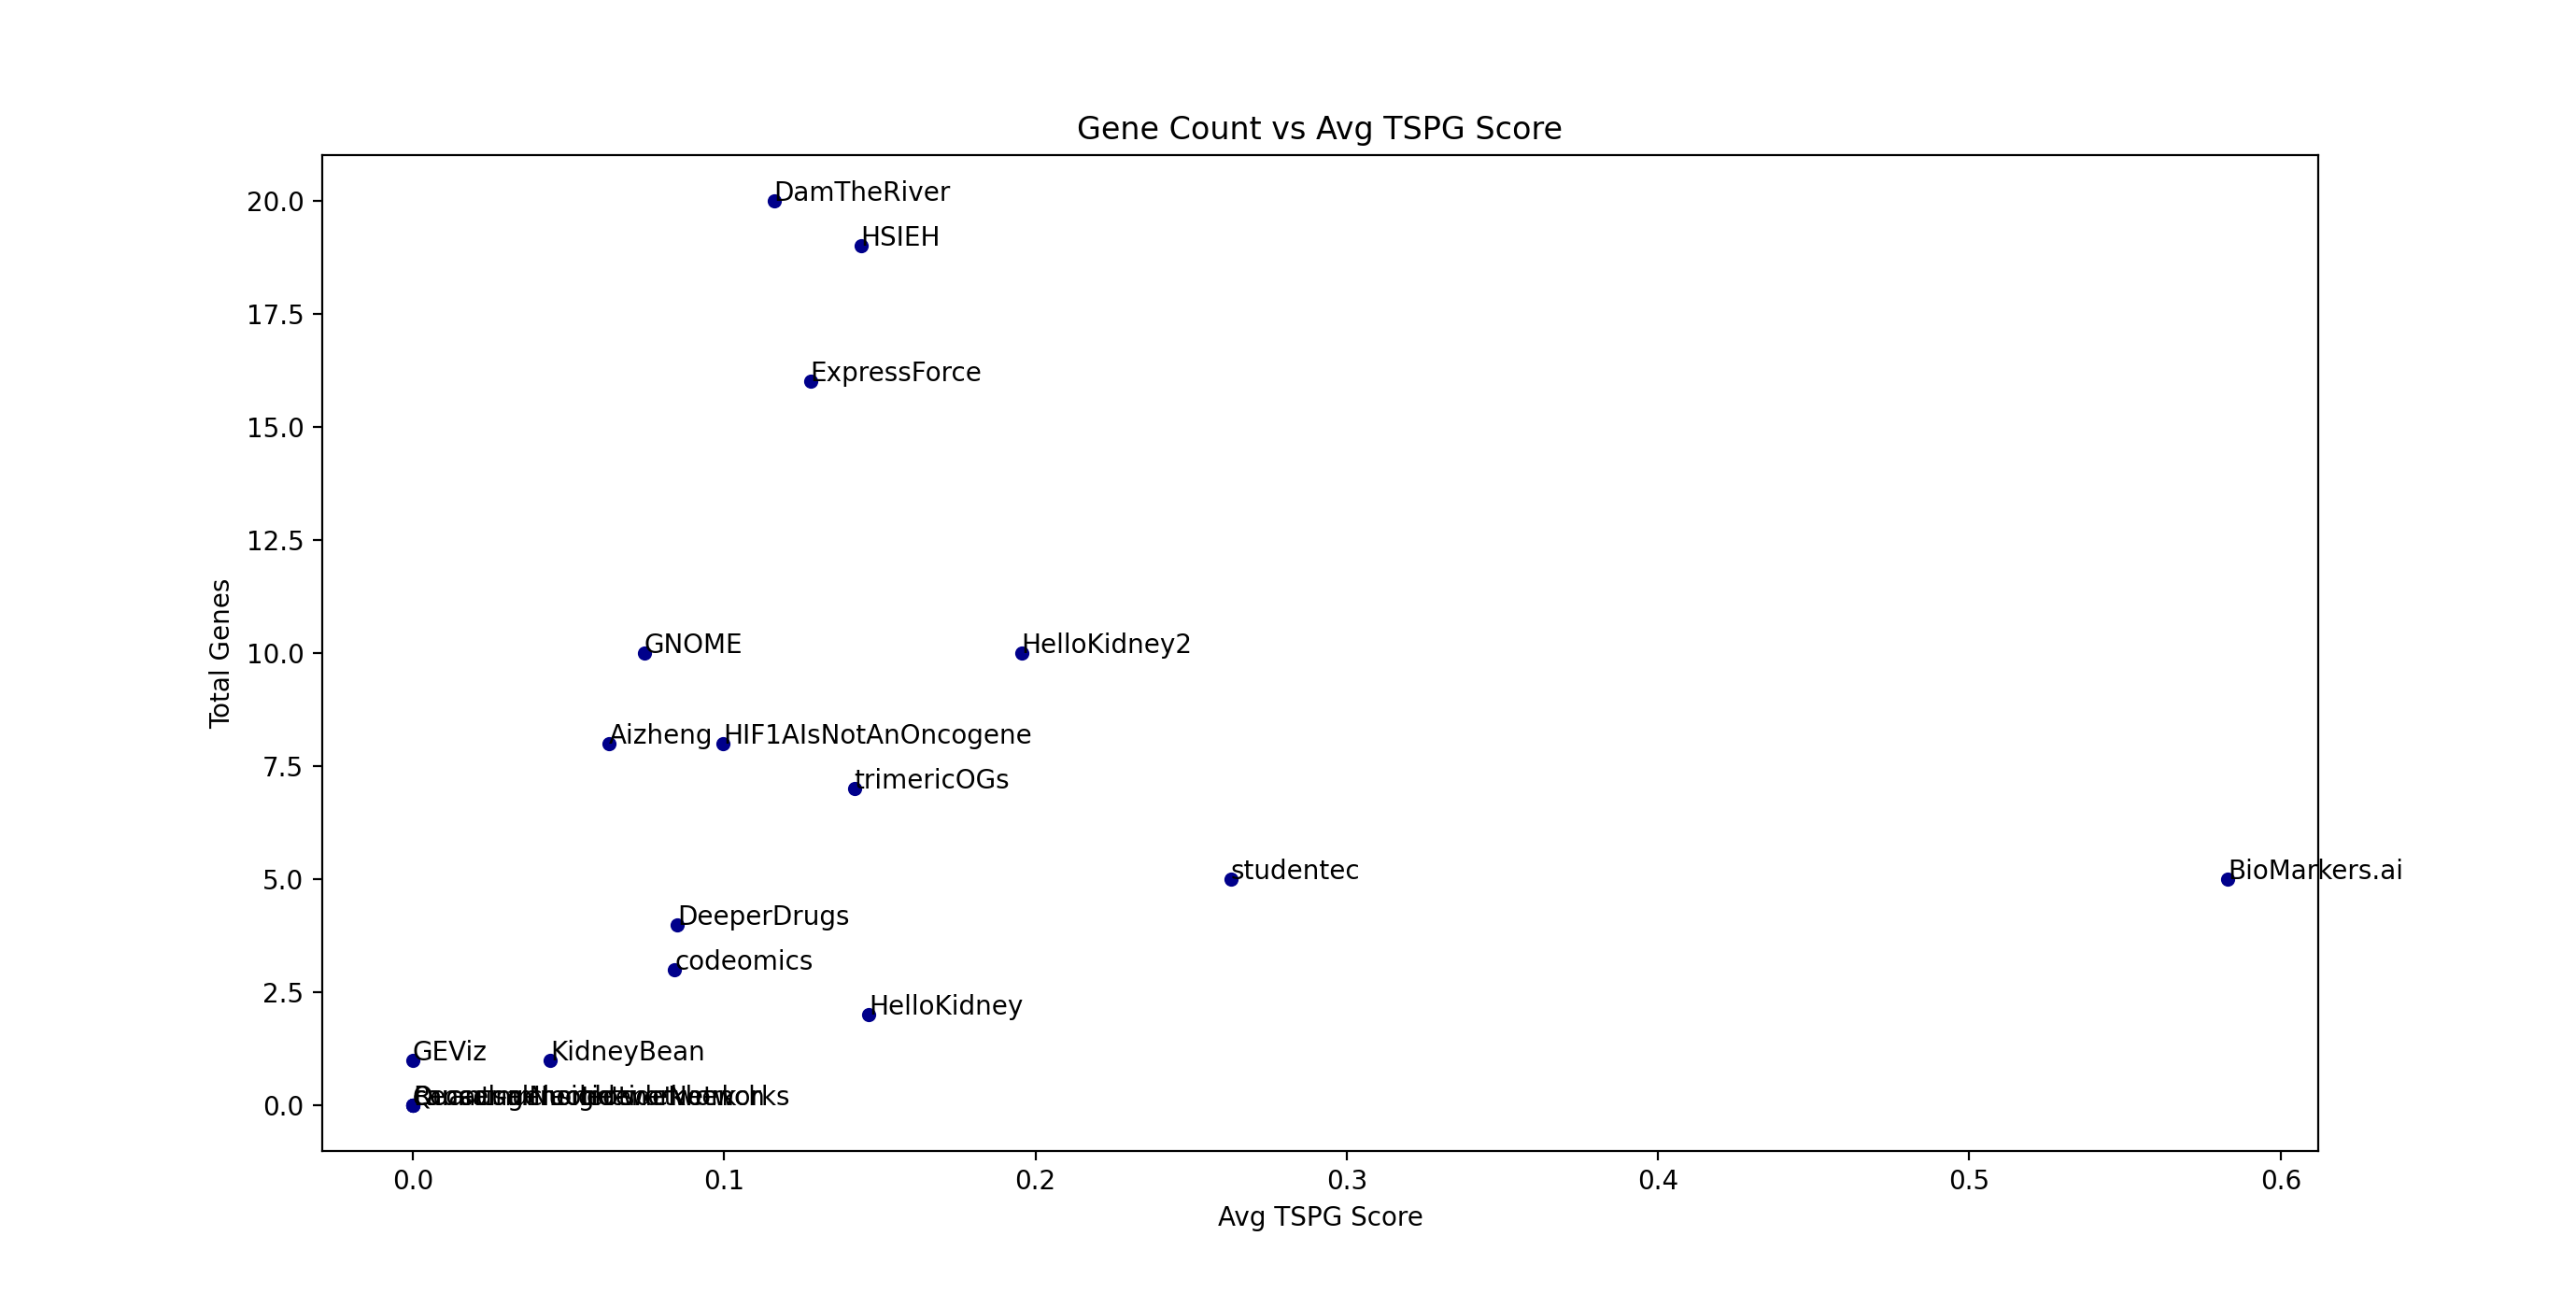
A 2019 article entitled “Can Big Science Be Too Big?” posited that papers with few authors tended to report more breakthrough research and papers with many authors tended to confirm existing findings. Our analysis lends credence to team size being a factor in producing good results. As an aside, our experience is that small teams are generally very performance focused. Dr. Sayad's team in particular was small and focused.
March 2021 TLFRCC (Thyroid-Like Follicular RCC) investigation
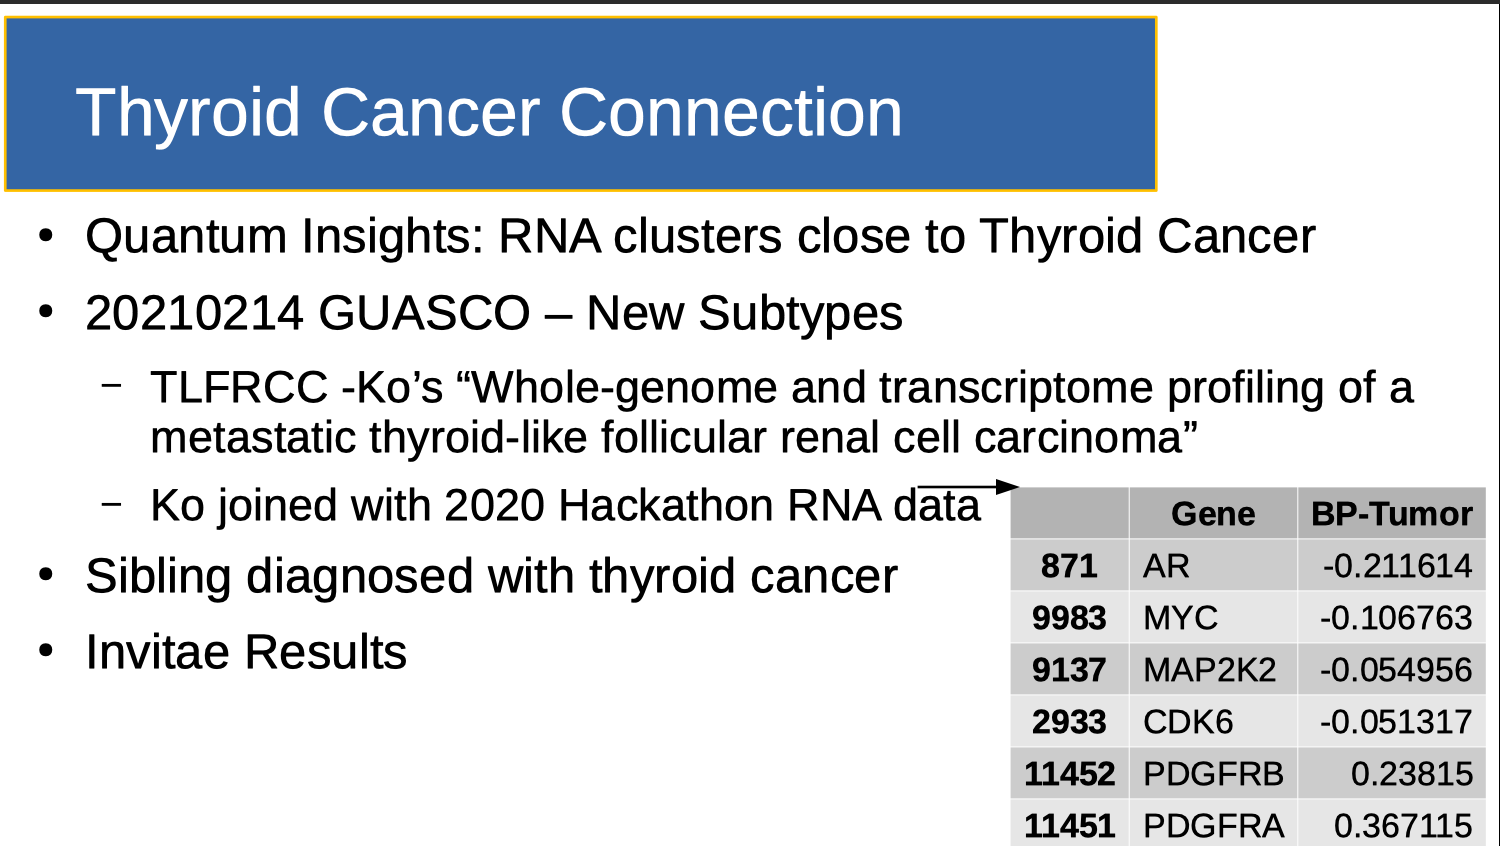
Eva Comperat discussed several new kidney cancer classifications at GUASCO 2021, including TLFRCC (Thyroid-Like Follicular Renal Cell Carcinoma). Given QuantumInsights.io's determination that my cancer clusters close to Thyroid Cancer, I combined Ko’s work with Clemson's 2020 normalized cohort. I note that the sorted differential expressions do not reach the outer bounds noted in the Team ranking table (0.56 and -0.28). So for the time being, I will likely spend my time researching Biomarkers.ai's findings, and not use this gene set to see if I have a genetic connection to thyroid cancer.
Output of QuantumInsights.io's clustering algorithm
Discussion
Research Grade Data, appropriate Tool choice and Team size likely make a difference in research team output.
Hackathons as ensembles of classifiers
Stepping back, the "Small Team" discussion indicates something intriguing. Treating hackathons as ensembles of classifiers allows us to get insight into the research process itself. I created a "holdout set" quite by accident. Suppose this was done deliberately? A hackathon can be structured to release DNA data first, have teams report results and then update them after the holdout set is released. In a real lab, results are generated continually. Suppose hackathon results were sampled at the end of each day? Then prediction accuracy would form a distribution which allows better characterization of each team's approach and method. Can we better measure the tools and data used to create results? Can we "boost" weak classifiers to get a better aggregate answer?
Note however that measurement needs to be done with care. Hackathons are a social event which (critically) depend on the goodwill of the participants. Turning it from an act of love into an act of labor is likely to produce suboptimal results.
In any case, subjectively, using a holdout set to score results seems to be a better approach than 'result overlap". But both approaches need to be verified and hopefully, new scoring methods developed.
Portfolio Theory
Note that Dr. Sayad outsized results are also predicted by portfolio theory. He took on a lot of risk: Using one tool (BIOada.com). Abandoning DNA data (using GEO instead). Using one method (Linear Discriminant Analysis). Using a small team (generating fewer new ideas). So his team was likely to either get a big win, or go bust. In that sense, a hackathon can be viewed as a portfolio of real options, and a hackathon “portfolio” has similar risk/return math to that used in financial portfolio construction. In particular, note that most companies in any high risk Venture fund are losers. But when times are good, one or two out of 30 investments provides returns that more than make up for the 28 or 29 losses. And like a venture portfolio, all the patient needs is one really good win. So it makes sense for the majority of teams participating in a hackathon to take riskier approaches. Not only does it give them a better chance at a ‘win’, it also give them the opportunity to try out ideas they don’t typically get to explore in a government lab. From the patient’s perspective, a 3 day hackathon investment is like buying a call option on the work of each participant. Cheap downside, life saving upside.
Conclusions and Future Work
Becoming facile in rare disease research requires a deep knowledge of medicine, science and biology. Absent retraining, it is unlikely that someone with just a few engineering degrees (like me) can naively tackle this field. However those engineering degrees have taught me something about scaling processes, catalyzing them (speeding them up) and doing iterative improvement. And the approach described here, which separates the knowledge of the rare disease (known by the biology teams), from the construction of the research event (known by the hackathon organizers) is one way to iteratively improve the rare disease research process. In particular, we have described a patient-lead approach, using small research teams trying a variety of methods to accomplish a specific goal over a short timeframe with open data and quickly released results. In essence, at the organizational level, we have reimagined the collection of hackathon teams as an ensemble of classifiers. This has allowed us to apply ensemble learning techniques to the research process itself. We have described three mechanisms of prioritizing ensemble results: "Canonical Genes" (Dr. Hsieh's list), "Discovery Overlap" and a "Differential gene expression holdout set" (from "Clemson's 2020 normalized cohort"). We have applied the last two of these scoring methods to research generated by 17 different teams.
This approach has produced novel personalized research, but it IS unverified. Dr. Sayad has been kind enough to offer to help me independently verify Biomarkers.ai's conclusions and extend it to therapeutic recommendations. This will be in a forthcoming blog post. Key Point however, of the 17 squares I get to bet on, this is the one I'm betting on next.
Finally, in addition to providing faster answers to medical research questions, hackathons provide an opportunity to research "research" itself.
Acknowledgements
An obvious point needs to be made explicitly here. Though I contributed data on the front end of the process and did a few SQL table joins and sorts on the back end of the process, NONE of the biology is my work. It is the work of the many volunteer researchers who spent many hours exploring my data on my behalf. Thank You.
- Tissue: UCSF's Dr. Max Meng and Tasha Lea
- Sequencing: Yale's Dr. Kaya Bilguvar and Christopher Castaldi and UCLA's Dr. Brian Shuch
- Sequencing Experiment Specification and Validation: Mike D'Amour for specifying the sequencing experiment parameters and fastq Validation Process (see this report)
- 2018 Venue Donation: Salesforce's Steve Tamm and Lisa Ferrier
- 2018 Hackathon Teams
- 2018 Biomarker.ai Lead: Dr. Saed Sayad
- 2018 and 2020 Hackathon Master of Ceremonies: Ben Busby
- 2020 Hackathon: The TRI-con organizer: Kaitlyn Barago of healthtech
- 2020 Hackathon: Research to the People Organizer: Pete Kane
- 2020 Hackathon: "Clemson's 2020 normalized cohort" creators: Reed Bender, Ben Shealy and Benafsh Hussain from Dr. Alex Feltus' group
- 2020 Hackathon: Therapeutic Recommendations: GeneXplain's Dr. Jeannette Koschmann
- 2018 and 2020 Target Identification: QuantumInsights.io's Bernard Chen and Marvin Weinstein
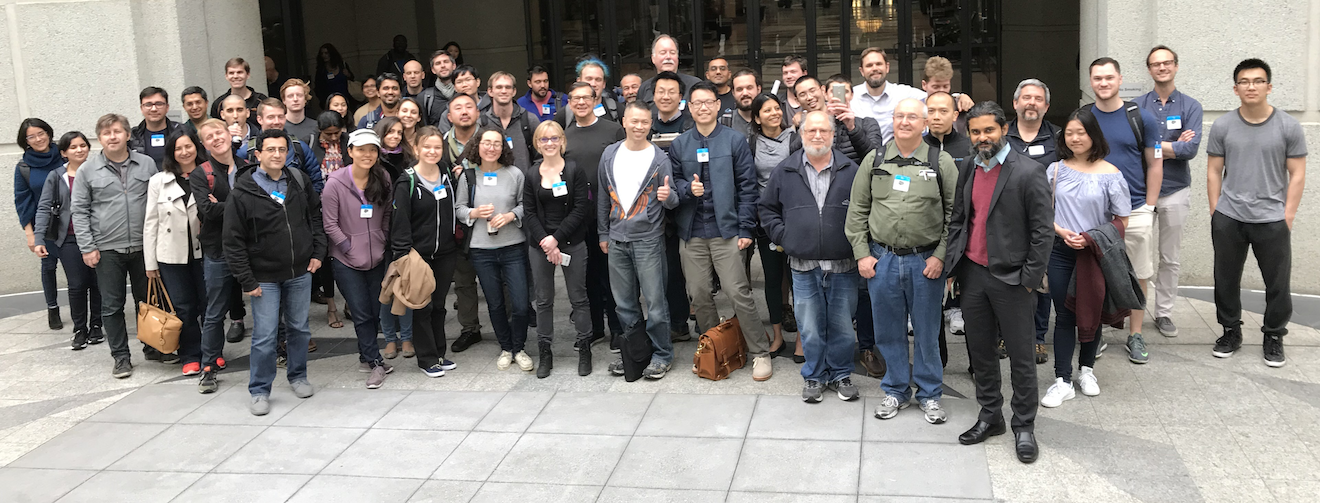
- 2018 Hackathon: sv.ai volunteers left to right Ryan Leung, Clayton Melina, Lily Vittayarukskul, Hunter Dunbar, Pete Kane, Bill, Dom Jones, Marguerite, David Schachter, Anabelle Tang. Not pictured: Nina Sardesh, Sean Davis
Add new comment